Posts

Showing posts from October 21, 2007

day trading notes

Image
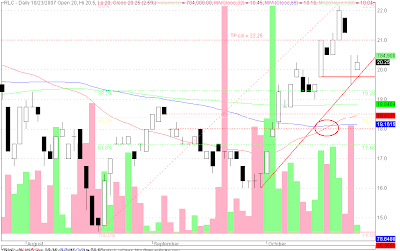
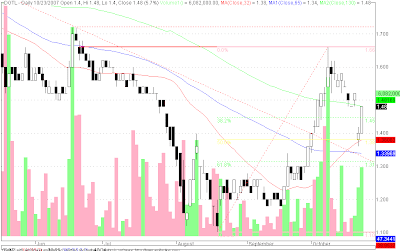
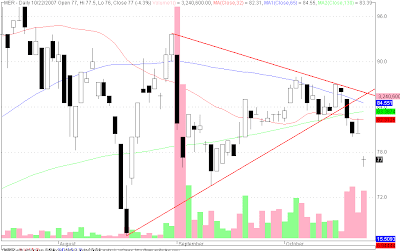
Bought MER at 83; higher high Bought GMAP at 8.6; island gap reversal Bought TA at 2.28; i thought it was going to be suspended when it hit 2.3, the ceiling price for today; bought more at 2.26; bought more at 2.2; bought more at 2.16 Bought DIZ at 10.25 PX gap up and trading at all time high; having trouble breaking thru resistance at 9.7; px new all time high at 9.8 GEO higher high and higher low; trading above 2.5; 2.5 might be new support TA possible gap up with very big volume... buy at close if gap up not closed :) might test 1.9 at all time high :) all time high! change in fluctuation at 2 :) DIZ possible gap up PERC possible gap up and possible breakout at 11.75 resistance with volume NRCP lower low... PCOR higher high possible higher low

Notes: At the Open

Image
Bought MER at 83 Bought GMAP at 8.6 PX gap up and trading at all time high; having trouble breaking thru resistance at 9.7 GEO trading above 2.5; 2.5 might be new support TA possible gap up DIZ possible gap up PERC possible breakout at 11.75 resistance

GMAP - possible island reversal

Image
GMAP = 8.5 ( 3.7% ) GMAP formed a gap up white candle but volume did not expand. GMAP looks to have formed an island reversal :) hopefully it reverses into an uptrend. It will be confirmed on Friday if there is an uptrend if GMAP is able to form higher highs and higher lows :) Resistance: 8.5 Support: 8.4 Good luck to all GMAP traders!

NRCP - trying to close the previous gap down

Image
NRCP = 3.55 ( 2.9% ) NRCP formed at shaven white candle with higher high and higher low to test the previous gap down and the resistance from 32 and 65MA. I do hope NRCP would be able to close the gap come friday. Resistance: 32-65MA; 3.55 Support: 3.45 Good luck to all NRCP traders!

GEO - testing resistance

Image
GEO = 2.5 ( 4.2% ) GEO formed a top shaven white candle with higher high and higher low to test a resistance made by a change in fluctuation at 2.5 and is trying to close a previous big gap down. Resistance: 2.5 Support: 2.4 Good luck to all GEO traders!

EDC - forming aggressive demand line

Image
EDC = 7.6 ( 1.3% ) EDC formed a white shaven candle with a higher high and higher low. I do hope EDC tries to test all time high of 7.8 Resistance: 7.6 Support: 7.4 Good luck to all EDC traders!

Disclosure

Image
Late disclosure: Sold almost half of my positions of MER at the open via "good til canceled" at 82

PSEi - higher low

Image
PSEi = 3767.78 ( 0.1% ) PSEi formed a white candle with a higher low. Seems like there is some resistance in closing the previous gap down. Resistance: 3772 Support: 3752 Good luck to all traders!

MER - looks bullish with shaven white candle

Image
MER = 82 ( 5.1% ) MER formed a shaven white candle with higher low and higher high to close a previous gap down. Looks bullish. MER seems to be headed for level of resistance as it moves upward from the 32-130-65MAs before it tries to test the supply / resistance line. Resistance: 82 Support: 80 Good luck to all MER traders :) Disclosure: got MER at the open at 80

GEO - tested 38.2% fibonacci retracement

Image
GEO = 2.4 ( 6.2% ) GEO formed white candle but with lower low and lower high to test/bounce from 38.2% fibonacci retracement. It will be a healthy retracement if GEO is able to bounce from 2.18 and test its recent high of 2.9. Which seems unlikely. Given that there seems to be forming a resistance at 2.44-2.55, a gap down. Another resistance is the change in fluctuation at 2.5. It is now a war between the bears and the bulls. It would be prudent not to place you positions in the middle of this battle, if your plan is for capital preservation. Bought GEO at 2.34 at the open, since there was great demand at the start which was pushing the price way beyond its previous close. It was a rollercoaster ride after getting inside GEO, since my cut loss was breached at the previous trading day's low of 2.24. I had hoped that GEO would be able to bounce from the 38.2% retracement, it did and was even able to form a white candle. So I am still holding... until the breach of support whi

PSEi - on its way to test supply line

Image
PSEi = 3763.47 ( 1.8% ) PSEi followed US markets lead and was able to form white candle with higher high and higher low. Closing near its high. Volume relatively small. I hope PSEi might try to test the aggressive demand line. Support: 3664 Resistance: 3772 Good luck to all traders!

Day trading notes

Bought GEO at 2.34 - GEO lower low; tested 38.2% retracement level at 2.18 Bought MER at 80 - MER higher high; closed previous gap down AT (possible H&S - possible breakout point: 16.25/16.5) - possible formation of gap up TEL higher high might test resistance at 3130 MEG possible gap up RCB possible gap up DIZ higher high - top gainer AC higher high EDC higher high IPVG lower low TA higher high and looks to form higher low COL higher high

San Miguel to buy 34% of Bank of Commerce

Image
San Miguel Stocks seem to be looking for levels of support... Maybe this news about buying Bank of Commerce shares will move the stock prices higher :) http://business.inquirer.net/money/breakingnews/view_article.php?article_id=96366 San Miguel to buy 34% of Bank of Commerce By Elizabeth Sanchez-Lacson, Doris Dumlao Inquirer Last updated 02:04am (Mla time) 10/24/2007 MANILA, Philippines--(UPDATE) Beverage and food group San Miguel Corp., through real estate subsidiary San Miguel Properties Inc. and San Miguel Corporation Retirement Fund, is acquiring a 34-percent stake in Bank of Commerce for P2 billion. Note : San Miguel Properties president Jeronimo Kilayko told the Inquirer that Bank of Commerce would become San Miguel Properties’ retail arm for financing as the San Miguel subsidiary forays into the competitive residential condominium market. Kilayko said San Miguel Properties planned to embark on its first residential condominium project next year on the

ISM - Smart sells Eastern Telecom stake to ISM

Image
ISM was able to close previous gap down - bullish. ISM formed higher high and higher low to form a shaven black candle... bearish sign 32 and 65MA might act as support levels. Good luck to all ISM traders :) Note hopefully this news will bring some... hope... Smart sells Eastern Telecom stake to ISM By Riza T. Olchondra Inquirer Last updated 04:22am (Mla time) 10/24/2007 http://business.inquirer.net/money/breakingnews/view_article.php?article_id=96373 (please visit the link for complete story) MANILA, Philippines--Smart Communications Inc., the cellular arm of Philippine Long Distance Telephone Co. (PLDT), has sold its holding of 2.5 million shares of Eastern Telecommunications Philippines Inc. to ISM Communications Corp.

TEL - found support

Image
TEL = 3035 ( 0.7% ) TEL gap up to form white candle. Looks like TEL might have found a support level at 2970. TEL looks like it is on its way to test supply line. Good luck to all TEL traders!

DJIA - upward momentum might be due to earnings

Image
DJIA = 13,676.23 ( 0.81% ) DJIA formed higher low and higher high to form a white candle - bullish. DJIA closed near the high of the day - bullish Would have been better if more volume was traded... DJIA looking for resistance :) Good luck to all traders!

PA - higher high and higher low

Image
PA = 0.205 ( 5.1% ) PA formed higher low and higher high, hopefully this upward momentum will test resistance at 0.24 Resistance: 0.215 Support: 0.2 Good luck to all PA traders!

EDC - closed previous gap down

Image
EDC = 7.1 (0.0%) EDC was able to close the previous gap down - bullish sign. EDC formed a cross - mixed signal. EDC formed higher low and higher high - bullish signal. I am bullish with EDC. I am inclined to believe that EDC might be able to form a higher low tomorrow but I have my doubts as to whether EDC can also produce a higher high. A higher low will keep me from selling my position. A higher high, closing at its high with significant volume will most likely make me buy into EDC and hopefully that momentum will test the recent all time high of 7.8. Resistance: 7.4 Support: 7 Good luck to all EDC traders!

MER - trying to close the gap down

Image
MER MER formed higher low and higher high to form a cross. Not a very bullish sign but on the other hand MER is closing the previ0us gap down. MER seems to be forming a symmetric triangle... Resistance: 80 Support: 77.5

RLC - seems to forming a resistance

Image
RLC = 20.25 ( 2.5% ) RLC formed a white candle with a higher low. But its high matched the previous trading day's high at 20.5 - which might be a resistance level. RLC seems to be forming a very bullish demand line. Resistance: 20.5 Support: 19.75

DGTL - long white candle with significant volume

Image
DGTL = 1.48 ( 5.7% ) DGTL formed a white candle after opening on the close of the previous white candle with expanding volume :) very impressive :) Will DGTL's upward momentum try to test a resistance level at 1.52? Resistance: 130MA Support: 1.4 Good luck to all DGTL traders!

PSEI - holding on to its support

Image
PSEI = 3697.17 ( 0.8% ) PSEI looks to be forming a support level above its previous gap up :) I do hope this continues... we will find out on Wednesday :) PSEI formed a white candle and higher low :) PSEI may have taken its cue from the DJIA which was able to move up 0.33% :) Support: 3664 Resistance: 3729 Good luck to all traders!

DJIA - white candle but lower high and lower low

Image
DJIA = 13,566.97 ( 0.33% ) DJIA was able to form a white candle... could be a bullish sign... But continued to form lower highs and lower lows... bearish sign... Mixed? A bullish scenario would have a higher low or if it was able to form a white candle that penetrated the halfway point of the previous black candle. The price action today is bearish, in my humble opinion. So concern should still be in the air as we trade to trade for gains on out issues... Support: 13,407.49 (likely to be tested) Resistance: 13,587.22 (might be tested if DJIA is bullish) Good luck to all traders...

FLI - found support at 1.74

Image
FLI = 1.76 ( -8.3% ) FLI seems to be have found support at 1.74. FLI previously tested this support level and bounced up to test its recent highs before succumbing to the pressure set by the recent bad news... Again FLI tested 1.74 and closed above it to form a white candle. It may seem that the bulls are still in FLI. It would be confirmed tomorrow if FLI forms another white candle, higher lows and higher highs. A gap up with significant volume will make us consider a buy. Support: 1.74 (I hope it holds) Resistance: 1.8-1.9 (gap down) Good luck to all FLI traders!

EDC - might have found support

Image
EDC = 7.1 ( -2.7% ) EDC might have found support from previous gap up. After opening gap down EDC tested support and then closed above its open to form a white candle. Though there is still a huge gap down to fill, EDC might be able to do that job. For the bulls to show us that they control EDC: EDC must form higher highs and higher lows on Tuesday. It is a concern that there is an aggressive supply line that will be a resistance level for EDC. Support: 6.9 Resistance: 7.1-7.3 Good luck to all EDC traders! Note: I would consider to buy EDC if it is able to form higher lows and higher highs tom with significant volume. It will certainly be a buy if it is able to gap up with big volume.

PA - bullish?

Image
PA = 0.195 ( -4.9% ) PA gave us a scare by forming a gap down at the open. PA looked for support and might have found it at 0.17. PA then closed the previously formed gap down and closed higher than its open... to form a white candle. PA would confirm bullishness if it is able to form higher lows and higher highs come Tuesday. Resistance: 0.24 Support: 0.17 Good luck to all PA traders!

GEO - gap down to look for support

Image
GEO = 2.34 ( -11.7% ) GEO... GEO gap down huge and looking for a support level. 130-32-65MAs might offer support... Support: 2.3 (likely to be broken tomorrow) Resistance: 2.44 (likely to hold for a long time...) Good luck to all GEO traders...

GMAP - gap down to reach new all time low

Image
GMAP = 8.2 ( 3.5% ) GMAP just keeps on forming lower and lower lows. A heartbreak to all who are bullishly holding on to this issue. GMAP also formed a gap down to really let us know that the bears are in charge. Support: 7.9 (likely to be tested again tomorrow) Resistance: 8.3 (likely to be a significant resistance level for days... weeks... months... to come...) Good luck to all GMAP traders... Note: If you wanted to get a seat at the board of GMA... GMA7 most likely will be a bargain in the coming days... so buy it then... then sell GMA to ABS for a profit... (hahaha! joke!)

MER - gap down to look for support

Image
MER = 77 ( -4.3% ) MER formed gap down - very bearish sign. MER closed at its open giving us a rather undecided signal from the bears and bulls. MER must form a white candle, higher high and higher low to let us know the bulls are getting back in the game. Chances are slim that this will happen. A test of the support is a more likely scenario. Support: 75.5/73.5 Good luck to all MER traders!

PSEi - testing support

Image
PSEi = 3667.87 ( 4.0% ) PSEi valiantly showed how bullish it was by closing above its support after breaching it intraday... But the bears are the in control and will likely test and break that support tomorrow. The bears were also able to make the PSEi gap down today. That gap would likely be a resistance level. For the bulls to show us that they are in control, PSEi needs to form a white candle, a higher high and a higher low, a gap up would definitely make us rally with the bulls. Support: 3664.63 (likely to be broken tomorrow) Resistance: 3753.04 (gap down) Good luck to all traders

Disclosure

Sold all of my AC at 550 Sold all of my PAX at 12.5 (intraday high) Sold all of my FPH at 86 (intraday high) Sold all of my AP at 5.4 (intraday high) Sold all of my COL at 12.5 (intraday high) This is deceivingly a great way to cut losses by selling at the intraday high... but this was hard to do and I was only able to get 5 of my positions out... I still have a pending 12 positions which I was not able to sell today... Mainly due to the fact that most of them formed gap downs whose highs did not reach my selling price... which in retrospect I should have posted my sells at those prices... On a strategic point of view today was a good trading day for me as a trader because I was able to take out 5 of my positions including AC which would likely incur significant losses because of the tragic destruction of glorietta 2... I would like to get back into the stocks that I have sold once they have bottomed out or formed a reversal pattern... Just so I can put my strategy into cutting loss

AP - will look for support on monday

Image
AP = 5.6 (0.0%) Good luck to all AP traders...

SM - will look for support on monday

Image
SM = 395 ( -1.3% ) Good luck to all SM traders...

RLC - will look for support on monday

Image
RLC = 21.25 ( -3.4% ) Good luck to all RLC traders...

FPH - will look for support on monday

Image
FPH = 87.5 ( 0.6% ) Support: 83.5/ 130-65-32MAs Good luck to all FPH traders...

DGTL - will look for support on monday

Image
DGTL = 1.52 ( 2.7% ) Support: 1.48/ 130-32-65MAs Good luck to all DGTL traders...

GEO - will look for support on monday

Image
GEO = 2.65 ( -3.6% ) Support: 2.5/130-32-65MAs/2 Good luck to all GEO traders...