Posts

Showing posts from February 10, 2008

PSEi - still respecting aggressive supply/resistance line

Image
PSEi = 3182.85 ( -0.90% ) PSEi formed a 3rd black candle with lower low and lower high. Volume decreasing. PSEi on its way to test possible support at 3176, a previous recent low... PSEi respecting aggressive resistance line... Bearish... Durng the previous week 65MA crossed below 130MA... Bearish... Price below 32MA... bearish; 32MA below 65MA... bearish; 65MA below 130MA; bearish... PSEi RSI formed an aggressive resistance line... MACD: fast line above signal line, buy; both below zero line, short (Buy, Short) Bollinger Bands constricting: decrease in volatility? Price being supported by Parabolic SAR: still bullish? Careful traders...

SM - aggressive supply line

Image
SM = 297.5 (0.0%) SM formed a doji with lower low and lower high. Volumed increasing. SM seems to have formed an aggressive supply/resistance line. Careful SM traders...

MEG - forming aggressive demand line

Image
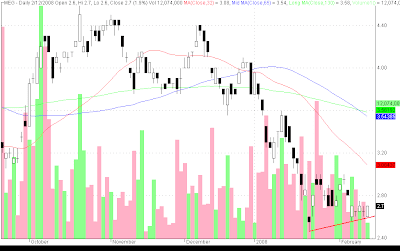
MEG = 2.7 ( 1.9% ) MEG a white candle. Volume decreased significantly. MEG seems to be forming an aggressive demand line. I hope this holds :) Good luck to all MEG traders!

GEO - symmetric triangle?

Image
GEO = 1.18 (0.0%) GEO formed another black candle with lower high. Volume decreased significantly. GEO seems to be forming a symmetric triangle. I hope it breaks out :) Good luck to all GEO traders!

DJIA - confirms bullish engulfing

Image
DJIA = 12,373.41 () DJIA forming a bottom shaven white candle with higher low and higher high. DJIA seems to have confirmed the reversal pattern: bullish engulfing, by forming higher low and higher high. Good luck to all traders! News: Blue chips rally on Buffett Dow and S&P 500 jump on billionaire investor's offer to help bond insurers and a plan for mortgage lenders to help homeowners. Tech-fueled Nasdaq can't hold on to gains.

PSEi - downtrend?

Image
PSEi = 3200.9 ( 0.7% ) PSEi formed a white candle with higher low and higher high. Volume decreasing. PSEi still seems to be heading down. A saving grace though is the formation of a higher low with might be telling us that the bulls are trying to regain control. PSEi needs to form a higher high and higher low to give us a clear sign that the bulls have regained control. PSEi still trading below the 32MA, 65MA, and 130MA. Bearish. PSEi still has downward bias as can be seen by the supply line that I drew on the chart. PSEi needs to breakthrough this possible resistance line. Good luck to all traders!