Posts

Showing posts from March 2, 2008

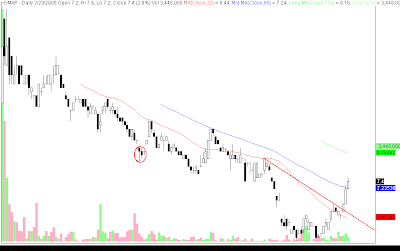
PCOR - break of resistance

Image
PCOR weekly formed another white candle with higher low and higher high. PCOR weekly moved above possible resistance of 6.0, now hopefully serving as level of support. PCOR = 6.2 ( +5.1% ) PCOR formed another white candle with higher low. Volume decreased slightly. PCOR moved above possible resistance of 6.0 and tested it as a support level last trading day. Bullish. But I doubt that it will hold this coming bloody Monday. I hope it does hold... Good luck to all PCOR traders!

GMAP - rally?

Image
GMAP weekly formed another white candle with higher high and higher low. GMAP weekly parabolic SAR was also hit and is now hinting that GMAP might be trending upwards... GMAP = 7.4 ( +2.8% ) GMAP formed another white candle with higher low and higher high. Volume decreased. GMAP seems to have moved above a possible aggressive resistance or supply line. Bullish. GMAP seems to be rallying or trending up. Bullish. GMAP moved above the 65MA. Bullish. GMAP MACD now moving above the zero line, to signal a buy long. Bullish. GMAP RSI after breaking a possible resistance line continues to trend up and possibly test the overbought limit pegged at 70. Bullish. I hope GMAP continues this bullishness, but this coming bloody Monday will surely be a test of the strength of the upward momentum of GMAP... Good luck to all GMAP traders!

AT - on its way to test resistance

Image
AT = 11.25 ( +4.70% ) AT weekly formed a 3rd straight white candle with higher low and lower high. Might be on its way to test supply or resistance line. AT formed a big white candle with higher high. Volume decreased. AT seems to be on its way to test the resistance or supply line. AT was also able to move above the 32MA. Bullish. I can only hope that AT will be able to continue to form higher lows and higher highs, especially on the coming bloody Monday... Good luck to all AT traders!

DJIA weekly - deceiving?

Image
DJIA weekly formed a black candle with higher high and higher low. Volume increased. DJIA seems to be rallying or trending up... and this was confirmed by the formation of higher highs and higher lows... but the drastic downward movement of the DJIA last Friday leaves little room for an optimistic Monday... Careful traders...

PSEi weekly - continues correction/downtrend

Image
PSEi weekly formed a white candle with lower low and lower high. It seems like PSEi is on its way to test the slightly aggressive support or demand line. With the huge downward movement by the DJIA last Friday there is a potential that the local PSEi might head south also... Careful traders...