Posts

Showing posts from December 2, 2007

DJIA weekly chart - confirm bullish engulfing

Image
DJIA = 13,625.58 (0.04%) DJIA formed a white candle with higher high and higher low but decreased volume. DJIA seems to have confirmed a previous formation of a bullish engulfing pattern int he weekly chart. Good luck to all traders!

DJIA - doji

Image
DJIA = 13,626.07 (0.05%) DJIA formed what seems to be a doji with higher high and higher low and decreasing volume as it tries to maintain bullishness. Good luck to all traders!

MER - gap up white candle

Image
MER = 88.5 ( 7.3% ) MER formed a gap up white candle to move above the 130MA with significant increase in volume. MER broke out of what seems to be an aggressive supply line. MER manage to break the recent previous high of 88. MER posted greater volume since 9 septmeber 2007. Recommendation: hold until there is clear sign of reversal :) Support: 130MA, 84.5 Resistance: 93.5-94 Good luck to all MER traders!

PSEI - gap up white candle

Image
PSEI = 3733.96 ( 2.3% ) PSEI formed a gap up white candle with increasing volume to move above the 32MA and looks to be attempting to close previous gap down. Very bullish :) PSEI seems to be on the move to close the previous gap down (3769-3740) :) Hopefully, PSEI will again manage to achieve higher high and higher lows Support: 3676 Resistance: 3754 Good luck to all traders! :)

ICT - breakout; new all time high

Image
ICT = 47 ( 11.9% ) ICT formed a long white candle to move above the resistance level at 42.5 to form a new all time high. Breakout with significant increase in volume. Support: 42.5 (previous level of resistance) Good luck to all ICT traders!

DJIA - rally testing aggressive supply line

Image
DJIA = 13,371.72 ( +0.45% ) DJIA formed a black candle with long upper and lower shadows and seems to have tested the aggressive supply line that is acting as a level of resistance. I hope this black candle doesn't act as a sign of reversal for the recent rally. Good luck to all traders!

PSEi - shortened trading week counter productive to US market rally

Image
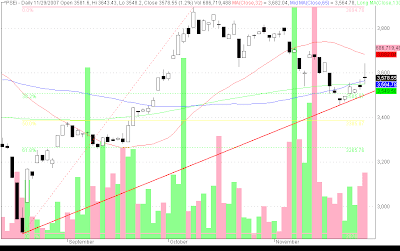
PSEi = 3578.55 ( 1.2% ) PSEi made a doji with a long upper and lower shadow to indicate indecision due to the mixed emotions brought about by the rally at US markets and the Siege of Manila Peninsula last Thursday. The position of all the moving averages are bullish since they are in their correct order: 130 below 65 below 32. 65 and 130MAs acting as levels of support for PSEi while 32MA will act as a level of resistance. I do hope that the doji formed last thursday does not abruptly reverse the rally for PSEI. Resistance: 3643, 3700, 32MA Support: 65, 130MAs, 3456 Good luck to all traders!