Posts

Showing posts from January 6, 2008

DJIA - black candle

Image
DJIA = 12,606.30 ( -1.92% ) DJIA formed a black candle with lower high and lower low. Volume decreasing. DJIA seems to be forming a support level around the 12,600 level. DJIA seems to be consolidating with resistance at 13,000 and support at 12,400 Good luck to all traders!

PSEi - formed island reversal?

Image
PSEi = 3503.7 () PSEi formed another white candle with higher high and higher low. Volume was significantly big, the highest volume since 15 November 2007. PSEi finally closed the previous gap down. PSEi might have confirmed the formation of the reversal pattern: island reversal. PSEi rallying or trending up to test resistance at 3667, a recent high. Good luck to all traders!

Day trading notes

Image
Day trading notes PSEi seems like it has formed an island reversal. Looks like it is forming another white candle with higher low and higher high. MEG higher high, closed previous gap down, among most active MER higher high, among most active AC higher high, among top gainers, among most active FLI higher high, among most active SM higher high, among most active ABA higher high, among top gainers DIZ higher high, among top gainers IMP lower low, among top losers

PSEi - gap up white candle

Image
PSEi = 3454.6 ( 1.10% ) PSEi formed a gap up white candle. Volume decreasing. PSEi almost closed the previous and recent gap down. Recent gap up will probably act as support level. Decreasing volume might be a hurdle to the rally being supported by the recent gap up. Good luck to all traders!

DJIA - white candle, finally!

Image
DJIA = 12,735.31 ( 1.16% ) DJIA finally forming a white candle after 8 straight days of black candle. Reversal? I hope. DJIA still formed lower low and lower high. RSI seems to be headed up after nearly touching after nearly touching the 30 level. Good luck to all traders!

GEO - continues to form higher highs

Image
GEO = 1.7 () GEO formed another white candle with higher high. Volume decreasing slightly. GEO seems to be rallying. I hope GEO continues to form higher highs. Good luck to all GEO traders!

PX - gap up doji to test resistance at 10

Image
PX = 9.9 ( 3.10% ) PX formed a gap up doji to test resistance at 10. Volume increasing. PX now trading above 32MA, which is above the 62MA, which is above the 130MA. Bullish. Good luck to all PX traders

ALI - continues to form higher lows and higher highs

Image
ALI = 14.25 (0.0%) ALI formed a 4th consecutive white candle with higher high and higher low. Big volume. ALI looks like it is rallying or trending up to test the resistance at 14.75. Good luck to all ALI traders!

PSEi - white candle with higher low

Image
PSEI = 3416.08 ( -0.10% ) PSEi formed another white candle with higher low and lower high. Volume increasing. PSEi seems to be gaining some upward momentum as can be seen by the formation of higher lows. I hope this continues and breaks the resistance formed by the previous gap down. Good luck to all traders!

GMAP - forming support at 7.4

Image
GMAP = 7.9 (0.0%) GMAP formed another white candle with higher low. Volume decreasing. GMAP seems to have formed a possible support at 7.4. I hope GMAP continues to form higher lows. Good luck to all GMAP traders!

NRCP - aggressive demand line?

Image
NRCP = 3.05 ( 1.70% ) NRCP formed higher low. Volume decreasing. NRCP seems to be forming an aggressive demand line. I do hope NRCP continues to form higher lows. Good luck to all NRCP traders!

PSEi - bullish engulfing?

Image
PSEi = 3422.7 ( 0.90% ) PSEi formed a white candle with higher high and higher low. Volume decreasing. PSEi seems to have formed a bullish engulfing pattern that may signal a rally to a technical bounce. I do hope PSEi continues to form higher lows and higher highs. Good luck to all traders!

DJIA - continue downtrend

Image
DJIA = 12,827.49 ( 0.21% ) DJIA has formed a 7th black candle and continues to form lower highs and lower lows. Volume increasing. Careful traders...

Day trading notes

Image
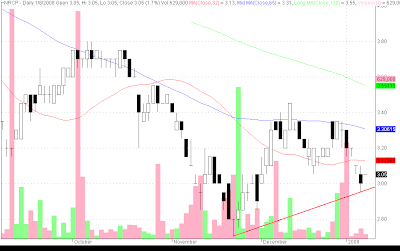
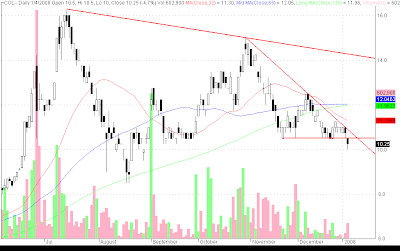
PSEi suffering from weakness of US markets PSEi might be forming a gap down, PSEi down almost 91 pts. GEO lower low, might be forming a gap down, among most active SM among most active, lower low, might be forming a gap down DIZ down more than 10%, among top losers, closed almost 17% down MEG down almost 7%, among top losers NRCP broke support at 3.05, might test support at 2.85 TA broke support at 1.3, might be forming gap down COL continues to formed lower lows, closed almost 10% down GMAP testing support at all time low of 7.4, might be forming gap down, closed on it's intraday high of 7.9, formed long white candle with shaven head, might have formed bullish engulfing. MBT almost 8% down, among top losers

SM - likely to test and break support at 330

Image
SM = 332.5 ( 0.80% ) SM formed a white candle. Volume decreasing. SM likely to test and break support at 330/327.5/325 Careful SM traders...

COL - break down

Image
COL = 10.25 ( -4.7% ) COL formed another black candle with lower high and lower low. Volume increasing. COL moved below support at 10.5. COL possibly correcting or trending down. Take note of support levels and your stop loss levels, cut losses accordingly. Careful COL traders...

GEO - likely to test and break support at 1.68

Image
GEO = 1.70 ( -1.20% ) GEO formed another black candle with lower high and lower low to test support at 1.68. Volume decreasing. GEO likely to test and break support at 1.68. GEO likely to test support at 1.52 without regard for the aggressive demand line that it was forming. Take note of support levels and your stop loss levels, cut your losses accordingly. Careful GEO traders...

GMAP - likely to test and break support at all time low of 7.4

Image
GMAP = 7.7 ( -2.5% ) GMAP formed a doji with higher low and lower high. Volume increasing. GMAP likely to test and break support formed by recent all time low at 7.4. Take note of support level and your stop loss levels and cut loss accordingly... Careful GMAP traders...