Posts

Showing posts from January 13, 2008

Day trading notes

Image
DJIA fell 307 pts. PSEi might be forming another gap down. I hope PSEi forms a hammer to signal a reversal from the current downward momentum. FLI testing support at 1.16

DJIA - might test support at previous low

Image
DJIA seems to be on its way to test support made by the previous low on March 2007.

DJIA - fell another 307 pts

Image
DJIA = 12,159.21 DJIA forming a long black candle with lower low and lower high. Volume decreasing. DJIA seems to remain in a bearish mood... Careful traders...

GEO - gap down black candle

Image
GEO = 1.5 ( -7.4% ) GEO formed a 5th consecutive black candle. Volume highest since 6 december 2007. GEO seems to be correcting to trending down. Careful GEO traders...

FLI - range trade?

Image
FLI = 1.26 () FLI formed a shaven top white candle with higher high. Volume increasing. FLI testing a possible resistance at 1.26 after bouncing from a possible support of 1.16. FLI looks like it is trading the range between the resistance and support. Good luck to all FLI traders!

AT - long black candle

Image
AT = 11.5 ( -8.0% ) AT formed a long black candle with lower low and lower high. Volume increased significantly. AT looking to test support at 10.25? Careful AT traders...

GMAP - new all time low

Image
GMAP = 7.2 () GMAP formed a shaven top and bottom black candle with lower low and lower high. Volume increasing. GMAP achieved a new all time low... Careful GMAP traders...

NRCP - black candle

Image
NRCP = 2.9 ( -3.3% ) NRCP formed another black candle with lower low and lower high. Volume decreasing. I hope NRCP is supported at the 2.85 level... Careful NRCP traders...

PSEi - gap down black candle

Image
PSEi = 3248.89 PSEi formed another gap down black candle with a shaven top. Volume increasing. PSEi continued to correct. Most likely due to the pressure made by the fall in the US stock market. PSEi looking for support MACD confirms bearishness of the index by moving below the zero line and the fast line moving below the slow line. RSI also confirms correction or downtrend. A RSI of 31 is the lowest since arriving at the 18.71 on 17 august 2007. I do hope we do not test the support of RSI at 18... Note RSI is considered oversold when it reaches 30 or 20 depending on how much you can stomach the decline. Parabolic SAR at 3618. PSEi must reach this level for us to consider that PSEi is trending up or rallying. Careful traders...

DJIA - lower low and lower high

Image
DJIA = DJIA formed a black candle with lower high and lower low. Huge volume (largest volume in 3 mos.) DJIA small real body. Might be considered a doji. DJIA continues to correct or trend down... Careful traders...

DJIA - white candle

Image
DJIA = 12,778.15 () DJIA forming a long white candle with higher low and lower high. Volume appears to be decreasing. DJIA white candle with shaven bottom might indicate upward momentum in the short term. I hope DJIA continues to form white candles with higher lows. DJIA might feel some resistance at the 13,000 level. I hope this positive outlook on the US stock market propels the local market to higher highs and higher lows. IBM showed strong results, which helped the oversold US market achieve 3 digit gains. There seems to be a rumor that a rate cut will be coming soon for the US, this seems to be the news thats pushing the US market to gains. Good luck to all traders!

Day trading notes

Image
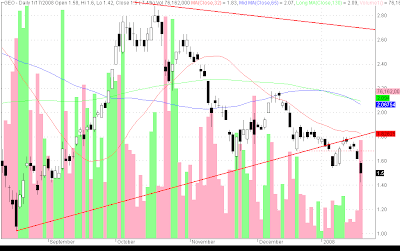
Day trading notes PSEi opens lower than previous close. PSEi succumbs to sell off of US stock market last friday. PSEi seems to have made a white candle by closing the trading day on its high. News: 1. The banking industry’s NPL ratio rose to 5.29% in October from 5.19% in September. 2. Meralco files for rate hike. 3. The BSP approved BDO’s joint ventures with Sta. Lucia, Filinvest, and Crown Asia 4. IPVG Corp. increased its all-cash takeover offer for PeopleSupport to US$17/sh from only US$15/sh. (News from the Philippine Daily Research section of Citiseconline.com; please visit their website for more information regarding these developments) PSEi gainers: BPI, GLO, SMPH, AC, SM, JGS, HLCM, LCB Note: Ayala companies holding the index steady with their gains PSEi biggest loser: TEL; the index heavywieght pulled the index back 17.10 pts.

DJIA weekly - 3rd black candle

Image
DJIA weekly DJIA formed a 3rd straight black candle with lower high and lower low. Volume continues to increase. DJIA testing support 12,400 Careful traders...