Posts

Showing posts from December 9, 2007

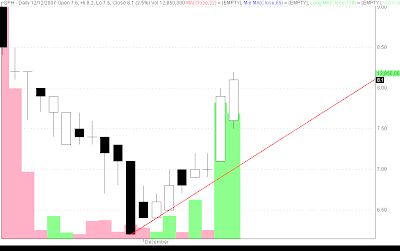
SPH - end of the rally?

Image
SPH = 8 ( -2.4% ) SPH formed a black candle with lower low and decreased volume. SPH seems to have met resistance at 8.4 SPH seems to have formed a bearish engulfing pattern, will be confirmed if SPH forms a candle with a lower low and lower high. I hope it does not confirm a bullish engulfing. Good luck to all SPH traders!

MER - correction or downtrend?

Image
MER = 80.5 ( -4.7% ) MER formed a long black candle with lower low and lower high and increased in volume. 65 MA looks to be acting as a level of support.

PSEI

Image
PSEI = PSEi formed a long black candle with lower low and lower high and increased volume. PSEi has broken the aggressive demand line and moved below the 32, 65, and 130MA. It seems that PSEi is correcting or downtrending. Careful traders...

DJIA - start of a rally?

Image
DJIA = 13,517.96 ( 0.33% ) DJIA formed a white candle with higher low and lower high and decreasing volume. I hope this is a start of rally to test the recent high. Good luck to all traders!

RLC - gap down black candle

Image
RLC = 16.5 RLC formed a gap down black candle with decreasing volume. RLC broke previous support and demand line. Careful RLC traders...

SMCB - big white candle with big volume

Image
SMCB = 55.5 SMCB formed a big white candle with higher high and huge volume. Good luck to all SMCB traders!

FLI - gap down doji

Image
FLI = 1.44 FLI formed a gap down doji with huge volume. FLI broke down previous support. Careful FLI traders...

MER - closed previous gap up

Image
MER = 84.5 MER formed a white candle with lower high and lower low and increasing volume slightly. MER seems to have close a previous gap up. Sold almost half of my MER at 84.5 Good luck to all MER traders!

SPH

Image
SPH = 8.1 SPH formed a white candle with higher high and higher low with significant volume but relatively smaller with respect to previous trading day. SPH to still be in a rally or uptrend. Good luck to all SPH traders!

PSEi - island reversal

Image
PSEi = 3605.59 ( -1.8% ) PSEi formed a gap down black candle with lower low and lower high and increasing volume. Bearish. PSEi closed at or below the 65MA. PSEi seems to have formed an island reversal pattern to signal more bearishness. Good luck to all traders!

DJIA

Image
DJIA = 13,432.77 ( -2.14% ) DJIA formed long black candle with lower high and lower low with increasing volume in response to disappointing 25 basis point rate cut by the FED. This might be a start of a correction or downtrend. Careful everyone.

Daily notes

Image
Daily notes: Sold half of MER at 84.5 FED cut interest rates by 0.25 basis points. Investors disappointed as seen by more than 2% decline in the US stock market PSEI testing support (broke?) it made with previous gap up... SPH higher high and higher low (likely to be trending up), among most active, increasing volume MER lower low and lower high, testing support at 84.5 FLI lower low (breakdown?) SMC/B higher high among top gainers RLC testing previous support at 17, closed at 16.5 below support MEG break of support at 4.15, closed at 3.95