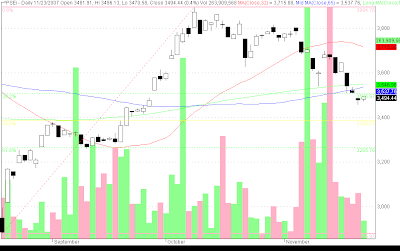
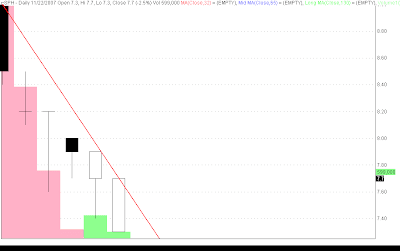
geo pre open suggest close of previous gap down, trading around the lower edge of the previous gap down, lost momentum, higher high, among most active, higher low NI pre open suggest close of previous gap down, lost momentum, higher high T bust secondary offering... SPH among top losers... bastich! DFNN possibly forming a pennant, lower low FPH among top losers ETEL among top losers WEB among top gainers PEP among top gainers LOTO higher high FGEN higher high LC higher high and higher low... might be respecting previous gap up as support level... might be a buy and hold till sing of resistance Note: Interview of absolute traders technicians at DZBB (594khz)on sunday 11am News: Technical problems are preventing the Philippine stock market from calculating the main index's moves on Friday, a spokesman from the exchange said. http://www.abs-cbnnews.com/storypage.aspx?StoryID=100122