Posts

Showing posts from 2009

Daily Notes

Image
Daily Notes Top Losers: BDO, lower low, currently at overbought levels (RSI = 85.7, highest for the past year) JGS RCB MWC, most active list ALI, most active list Stock Watch AT higher high, resistance at MA130 (4.9), intraday 4.45 (highest in the past 3mos.)
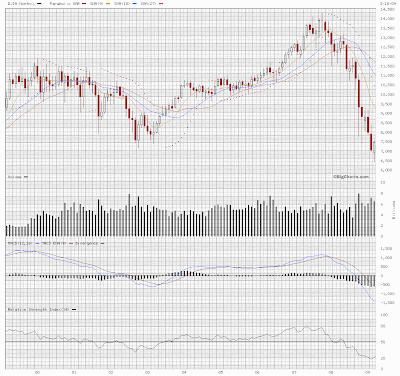
Is March 2009 forming a hammer?

Image
DJIA = 7486.58 First of all thank you for reading this post :) It has been quite a while since my last post :) Let me introduce you to the above chart generated for us by bigcharts.com :) This is a monthly candelstick chart of the DJIA for the past decade. We can note from this chart that the DJIA has again formed a new low for the past decade. I can only hope that the DJIA is truly forming a hammer for the march 2009. What Does Hammer Mean? A price pattern in candlestick charting that occurs when a security trades significantly lower than its opening, but rallies later in the day to close either above or close to its opening price. This pattern forms a hammer-shaped candlestick. Investopedia explains Hammer A hammer occurs after a security has been declining, possibly suggesting the market is attempting to determine a bottom. The signal does not mean bullish investors have taken full control of a security, it simply indicates that the bulls are strengthening. (from Investopedia.com) T