Posts

Showing posts from February 17, 2008

PCOR - continues to form higher lows

Image
PCOR = 5.9 ( 1.7% ) PCOR formed a bottom shaven white candle with higher low and higher high. Biggest volume since 18 January 2008. PCOR continues to form higher lows. Bullish. PCOR testing resistance at 6. PCOR continues to push the upper limit of the Bollinger band. Bullish. I hope PCOR continues to form higher highs. Disclosure: Bought PCOR at 6. Should have not anticipated the breakout. Could have gotten it today at 5.9 or waited for breakout at 6.1 Good luck to all PCOR traders!

GEO - confirms breakout

Image
GEO = 1.3 () GEO formed a botttom shaven black candle with higher low and higher high. Volume decreased slightly. GEO confirms breakout by forming higher low. GEO failed to impress by forming a bottom shaven black candle. GEO moved back below the 32MA. GEO tested resistance at 1.42. Failed to move above resistance. I hope GEO continues to form higher lows. I hope GEO moves above the resistance at 1.42. Disclosure: Bought more GEO at 1.4 Good luck to all GEO traders!

PSEi - interesting trading day tom

Image
PSEi = 3181.05 ( -0.3% ) PSEi formed a black candle/doji with lower high and higher low. Volume decreasing. PSEi might be forming a possible support/demand line. The coming trading day seems very interesting on whether the possible aggressive demand line will hold or whether the possible aggressive supply line will be respected. Good luck to all traders...

Day trading notes

Image
Bought GEO at 1.4 - might be a wrong move since GEO closed on its low today at 1.3. Hopefully GEO continues to form higher lows tom. Bought PCOR at 6 - good volume, should have waited and not anticipate the break out. Could have gotten PCOR at 5.9. PSEi testing aggressive supply/resistance line. DJIA higher high and higher low. On its way to test 12600. Attended Absolute trader's Chart Analysis forum last night at PSE Ortigas trading floor. GEO higher high. Among most active. GEO needs to close near its high to signal continued bullishness. Dismal intraday performance. Heartbreaker. PCOR higher high. Among most active. Testing resistance at 6. AT higher high. Among most active. Among top gainers. Closed previous gap down. TA higher high. Might test resistance at 1.32 MEG among most active, lower low RLC among most active, lower low, on its way to test support at 11.25 OM among top losers

AT - testing resistance

Image
AT = 11.5 AT formed a gap up white candle. Biggest volume since 8 February 2008 AT seems to be testing resistance made by previous gap down. AT moved above 32MA. Bullish short term. AT pushing upper level of Bollinger Bands. Bullish. Good luck to all AT traders! :)

GEO - Breakout!

Image
GEO = 1.38 GEO formed a big white candle with higher low and higher high. Biggest volume since 23 January 2008. GEO moved above the possible resistance line. Breakout with volume. GEO moved above the 32MA. Bullish in the short term. GEO MACD signaling buy, short. GEO pushing the upper level of the Bollinger Band. Bullish. GEO possibly on its way to test the following resistances: 1.42 - recent high 1.62 (65MA) 1.76 - recent high GEO might find support at: 1.36 (32MA) 1.28 previous resistance 1.18 big white candles low Good luck to all GEO traders! :)

DJIA - another black candle/doji

Image
DJIA = 12,337.22 DJIA formed another black candle/doji, with higher high and higher low. Volume decreasing. DJIA seems to be headed to test resistances at 12,600 and possibly 12,800. Good luck to all traders! :)

PSEi - testing aggressive supply line

Image
PSEi = 3190.67 PSEi formed a white candle with higher high and lower low. Biggest volume since 25 January 2008. PSEi still respecting aggressive supply line. PSEi might have formed a possible bottom or support at 3157 level. On its way to test aggressive supply line. Good luck to all traders! :)

NRCP - consolidating in the daily view but weekly view has potential

Image
NRCP = 2.85 (0.0%) NRCP formed a white candle with lower low. Volume increasing. NRCP seems to be consolidating in the daily candlestick charts and respecting a possible aggressive supply or resistance line. NRCP weekly formed a doji with higher low and higher high. NRCP weekly on the other hand looks to be promising. NRCP weekly seems to be forming an aggressive support or demand line. I hope NRCP weekly continues to form higher highs. Good luck to all NRCP traders!

DJIA weekly - white candle

Image
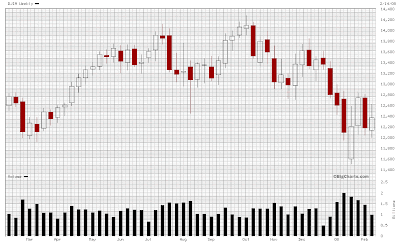
DJIA weekly formed a white candle with lower high and lower low. DJIA on its way to test support at 11,500? I hope not...

PSEi weekly - on it's way to test possible support at 3173

Image
PSEi formed an almost top and bottom shaven black candle with lower high and lower low. The formation of shaven top and bottom black candle might have bearish implications. An upper and lower shadow measures the uncertainty of the move to the upper and lower limit of the price action. The lack of uncertainty means that price is almost certainly or definitely bearish... Careful traders...

DJIA - top shaven black candle

Image
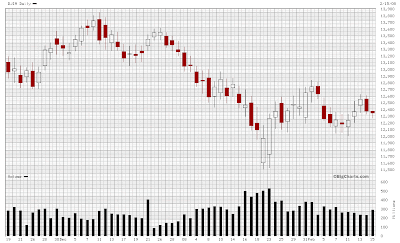
DJIA = 12,348.21 ( -0.23% ) DJIA formed a top shaven black candle with lower high and lower low. Volume increased. DJIA on its way to test support at 12,050? I hope not. Careful traders...