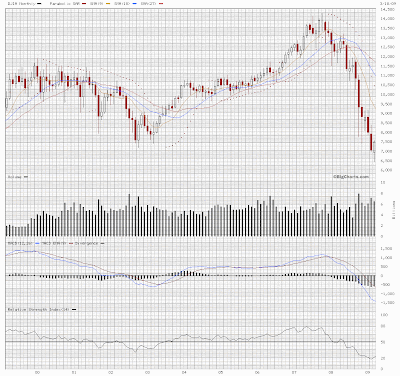
Is March 2009 forming a hammer?

DJIA = 7486.58 First of all thank you for reading this post :) It has been quite a while since my last post :) Let me introduce you to the above chart generated for us by bigcharts.com :) This is a monthly candelstick chart of the DJIA for the past decade. We can note from this chart that the DJIA has again formed a new low for the past decade. I can only hope that the DJIA is truly forming a hammer for the march 2009. What Does Hammer Mean? A price pattern in candlestick charting that occurs when a security trades significantly lower than its opening, but rallies later in the day to close either above or close to its opening price. This pattern forms a hammer-shaped candlestick. Investopedia explains Hammer A hammer occurs after a security has been declining, possibly suggesting the market is attempting to determine a bottom. The signal does not mean bullish investors have taken full control of a security, it simply indicates that the bulls are strengthening. (from Investopedia.com) T...