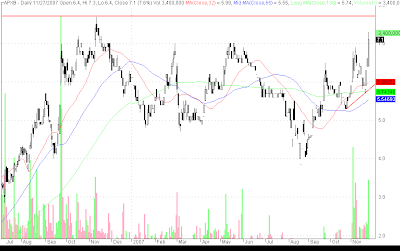
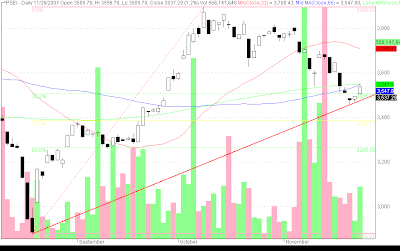
Posts

Showing posts from November 25, 2007

PSEi - black candle

Image
PSEi = 3537 ( 0.4% ) PSEi formed a black candle with higher high and higher low. 130 and 65 MAs still resisting bullishness of PSEi. PSEi seems to have formed an island reversal, which has been confirmed by the formation of higher lows and higher highs following the formation of the island PSEi formed a black candle eventhough US markets were bullish (behind the news of infusion of cash to Citibank). Resistance: 3572 Support: 3505-3496 (previous gap up) Good luck to all traders!

daily notes

Image
Trans-Asia starts rights offering SPH and VLL joint venture PSEi higher high, not closing as strong as i have hoped for... GEO higher high, among most active SMC/SMCB higher high, among top gainers MER higher high TA higher high NRCP higher high, among top gainers SM higher high LC higher high OM higher high MBT higher high, testing resistance at 55.5 MEG higher high AC lower low SMCB higher high, good volume, possible gap up, might be a good buy if it closes on its high, must close significantly above 48 or it might seem like it formed a doji or shooting star candlestick and might seem like a reversal pattern with a downward pressure on price, might be forming resistance at 49.5 FLI higher high

Notes at the open

Image
GEO higher high, among most active SMC/SMCB higher high, among top gainers MER higher high TA higher high NRCP higher high, among top gainers SM higher high LC higher high

DJIA - long white candle

Image
DJIA = 12958.44 ( 1.69% ) DJIA formed a long white candle with higher low and lower high and increasing volume. I hope DJIA continues to form white candles with higher lows Good luck to all traders. Let's hope this rebound is taken bullishly by the local market :)

The moment of truth by Fitz Aclan - a review

Image
FITZ ACLAN has again placed a new article on his column a t yehey.com (see side bar for link to: Thinking Out Loud and the latest article " The Moment of Truth") FITZ talks about the limited news about subprime losses due to the end of the earnings season in the US. On the technical side, he points out that there could be a technical bounce due to the oversold level of the markets. On the historical side, Fitz noted that December has always been a bullish market except for one occasion. Personally I like the timing of Fitz's article as it verifies my bullish outlook on my recent chart analysis especially the ones posted here today. I hope that December does become a Very Merry Christmas for all traders! Good luck in all your traders my dear friends and avid visitors of the Technical Insider!

APXB/APX - on its way to test all time high

Image
APXB = 7.1 ( 7.6% ) APXB formed a long white candle with significantly higher high and significant increase in volume. APXB looks like it has momentum to test all time high pegged at 7.7 APXB might also be forming a pole of a possible flag or pennant. Watch intently and trade carefully. Good luck to all APXB traders!

SM - continues to form higher lows

Image
SM = 345 (0.0%) SM formed another white candle with higher low but with decreasing volume. SM might have found some resistance at 345-347.5 level. Hopefully SM will move above this level of resistance. Good luck to all SM traders!

FPH - closed previous gap down

Image
FPH = 63 ( 3.3% ) FPH formed a white candle with higher high and lower low to close a previous gap down FPH seems to have formed a bullish engulfing pattern which might be a bullish sign. It will likely be confirmed if FPH manages to form higher lows and highs. FPH seems to be forming an aggressive demand line. Resistance: 67-68 (previous gap down) Support: 60, 58 Good luck to all FPH traders!

GLO - island reversal

Image
GLO = 1500 ( 1.4% ) GLO formed another white candle with higher high and higher low and increasing volume. GLO has formed an island reversal. Reversing the previous downtrend to what seems to be an immediate uptrend, or a consolidation at the least (but seems unlikely). GLO might be trying to search and test a level of resistance. Resistance: 65MA Support: 1460 Good luck to all GLO traders!

NRCP - might test possible resistance at 3.05

Image
NRCP = 2.95 (0.0%) NRCP formed a doji with higher low and lower high. NRCP might be on its way to test the possible resistance at 3.05.

SPH - possible hammer; new all time low

Image
SPH = 7.2 ( 2.7% ) SPH formed a black candle with a long lower shadow and lower low and lower high. SPH seems to be forming a reversal candlestick pattern: a hammer. It might be confirmed if SPH manages to form higher lows and higher highs in the following trading days... Good luck to all SPH traders...

PSEi = continues to form higher low despite weakness in US markets

Image
PSEi = 3524.19 ( -0.4% ) PSEi formed another white candle with higher low and lower high. 65 and 130 MA still acting as resistance levels. PSEi still respecting aggressive demand line. PSEi did not break demand line eventhough US markets were weak. Good luck to all PSEi traders!

GEO - closed previous gap down

Image
GEO = 1.86 ( 5.7% ) GEO formed a white candle with higher high and higher low to close a previous gap down. GEO needs to close above the previous gap down in the coming trading days. Reistance: 1.94, 65MA Support: 1.64, 1.52 Good luck to all GEO traders!

NRCP - continues to form higher high

Image
NRCP = 2.95 ( 3.5% ) NRCP formed another white candle with higher high and higher low. Bullish Volume significantly lower than previous trading day. 32MA below 65MA; 65MA below 130MA - Bearish NRCP needs to trade above the 61.8% Fibonacci retracement. Support: 2.7 Resistance: 3.0-3.05 Good luck to all NRCP traders!

PSEi - forming a demand line; gap up

Image
PSEi = 3537.29 ( 1.2% ) PSEi formed another white candle; gap up; with higher low and higher high. Volume increased. Bullish. PSEi closing the previous gap down. Hopefully PSEi will close above the previous gap down in the coming trading days. PSEi seems to be forming an aggressive demand line. 65 and 130MA acting as resistance level for PSEi. Support: 3455.9 Resistance: 65/130MA Good luck to all traders!

Daily notes

Image
Sold all my remaining LC at 0.51 (big supply at 0.52-0.53) PSEi closed previous gap down MBT featured at citiseconline, now trading higher, among top gainers SMCB among top gainers AT among most active GEO higher high, might try to close previous gap down, among most active, among top gainers, closed previous gap down LC higher high, possible gap up, among most active, among top gainers, possible gap up NI among most active, among top gainers DIZ among top gainers DFNN among most active

Notes at the open

Image
GEO higher high, might try to close previous gap down, among most active, among top gainers LC higher high, possible gap up, among most active, among top gainers, possible gap up NI among most active, among top gainers DIZ among top gainers DFNN among most active

GEO - testing resistance

Image
GEO = 1.76 ( -2.2% ) GEO formed a black candle with higher low and higher high to test resistance provided by a previous gap down. I hope GEO is bullish and will try to close the gap. Resistance: 1.86-1.94 (previous gap down) Support: 1.68, 1.52 Good luck to all GEO traders!

NRCP - Fibonacci retracement an explanation

Image
NRCP = 2.85 ( 1.8% ) NRCP formed a white candle with higher high and higher low and significant increase in volume since 3 October 2007. Bullish. NRCP might have found the bottom of its downtrend. NRCP must head back up more than 61.8% so that this recent rise in prices is not merely a correction of the downtrend. Said bottom might be considered a support level for NRCP. I hope NRCP continues to trend upwards. Using Fibonacci Retracements: one of the uses of fibonacci retracements is measuring the health of a pull back. Its seems vague. Let's use NRCP as an example: NRCP came from a recent high of 3.75/3.8 and trended downwards to hopefully produce a bottom at 2.75. If NRCP is to go down further it needs to pull back only until the 38.2% level for the pull back to be healthy and for NRCP to continue trending lower. If the pull back achieves more than 50% the pull back is not healthy. There can be a possible reversal that has formed or an area pattern could be forming. So f