Posts

Showing posts from October 7, 2007

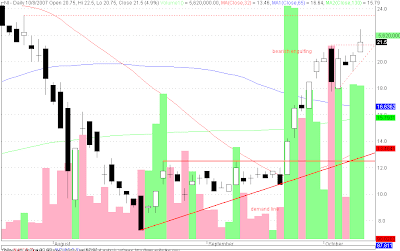
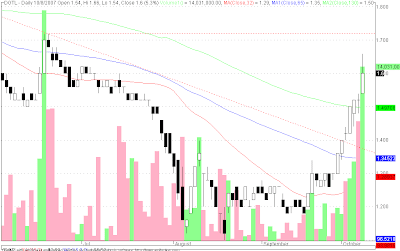
AT - testing supports

Image
AT = 15 ( -1.6% ) AT after the rally to reach a recent high of 16.5 is now forming lower highs and lower lows and looks to test supports. AT is testing the a support level made by a previous gap down. Applying a fibonacci retracement on AT we will note that a healthy 38.2% retracement is around 14/14.25 level. 32MA recently crossed above 65MA to support bullishness of AT. 32 & 65MA acting as support levels. 130MA acting as level of resistance Resistance: 16.5 Support: 14.75 Good luck to all AT traders!

GEO - consolidating with an aggresive supply line

Image
GEO = 2.55 ( -1.9% ) GEO seems to be moving sideways or consolidating for the time being. A cause for concern is an evidently aggressive supply line. This is with respect to the stable demand line at 2.5 a level that is a change in fluctuation. Caution is therefore recommended to everyone trading GEO. GEO remains bullish as it is trading above 32,65,130MAs. A buy can be recommended when 32MA moves above 65 and 130MA. Resistance: 2.8 Support: 2.5 Good luck to all GEO traders!

NRCP - having a hard time closing the previous gap down

Image
NRCP = 3.7 (0.0%) NRCP seems to be having a hard time closing the previous gap down. During the previous trading week NRCP was able to move above the 65MA and is not quite bullish with the price action above both the 32 and 65 MA. Good luck to all NRCP traders!

AC - bounces from support made by previous gap down

Image
AC = 590 ( 0.9% ) AC after reaching a high of 615 corrected/moved sideways to test support made by the previous gap down, which previously was a level of resistance. Applying a fibonacci retracement we can see that the 38.2% retracement at 530-535 is healthy and may continue to support the rally or uptrend. AC might look to test the resistance of the all time high at 615 after bouncing of the said gap down support, as evidenced by the higher lows and higher highs posted after the bounce. Resistance: 615 Support: 560 Good luck to all AC traders!

MER - respecting demand line

Image
MER = 83.5 ( -0.6% ) MER continues rally/uptrend and respects demand line. 32MA acting as immediate support alongside the demand line. 65MA acting as immediate resistance along side supply line. Resistance: 88 Support: 83/82 Good luck to all MER traders!

TEL - looking for a level of support

Image
TEL = 3090 ( -1.4% ) TEL after reaching an all time high of 3285 seems to be looking for a level of support. Applying a fibonacci retracement to its recent rally or uptrend, we can note that a healthy correction at a 38.2% retracement should be around the 2890 level, at this level the price action may bounce and continue it ascent. Also note the very sharp demand line that I have drawn on the ascent of TEL, if this is broken TEL will most likely be in a corrective phase and thus look for a level of support Also note 2820 the recent previous high may act as a support. Resistance: 3825 - New all time high! Good luck to all TEL traders!

DJIA - new high due to possible rate cut

DJIA = 14164.53 ( 0.86% ) DJIA formed new highs due to possible rate cut. Looks like things might be looking up for the PSE today! :) Good luck to all traders! "NEW YORK (MarketWatch) -- U.S. stocks rallied, with the Dow Jones Industrial Average and the S&P 500 both closing at new highs, after the release of Federal Reserve commentary that reinforced thoughts of another interest-rate cut ahead." - from : U.S. stocks rally to new heights on Fed minutes Wall Street closes higher with Dow and S&P setting new records, an article posted on MarketWatch.com 10/10/07 http://www.marketwatch.com/news/story/us-stocks-close-new-records/story.aspx?guid=%7BF3217BA3%2DF6D5%2D4F63%2D9076%2DFB1AC9099439%7D

MIC - on its way to test possible resistance at 9.2

Image
MIC = 8.4 ( 12% ) MIC formed a white candle and a gap up with significant volume. Looks like it might test recent high of 9.2 Good luck to all MIC traders :) looks like oops effect will be felt tomorrow for MIC! :)

FPH - resistance at 86

Image
FPH = 85.5 ( 1.8% ) After forming a gap up to breakout of a previous resistance FPH looks like it has again bumped on a resistance level at 86. Momentum seems to be intact as FPH continues to form higher lows. Resistance: 86 Support: 80 - previous resistance, 65MA, 130MA Good luck to all FPH traders!

NI - breakout

Image
NI = 21.5 ( 4.9% ) Congratulations to all the don and doñas with balls of steel who held NI and courageously endured the sideways movement signaled by the previous reversal signal: the bearish engulfing. Looks like the bulls are in charge again of NI since it closed above its recent previous high now looking to test a new resistance. Resistance: 23.5 - recent new high Support: Hopefully at 21.25 Good luck to all NI traders!

SM - impeded by previous gap down

Image
SM = 412.5 ( 0.6% ) SM still has yet to close the previous gap down and has become a significant impediment or resistance. Note SM still has momentum for the uptrend as can be seen by the price continuing to form higher lows. Resistance: 417.5-422.5-427.5 - previous gap down and recent resistance of price movement within the gap down Support: 390 - previous resistance and 130MA Good luck to all SM traders!

PA - bearish engulfing

Image
PA = 0.225 ( -16.7 ) Yikes! PA looks like it has formed a bearish engulfing... Careful... Support: 0.205 - possible support Resistance: 0.28 - recent or possibly all time high Note: PA needs to close above this level of resistance in order to maintain its bullishness and quell the bearish engulfing... Good luck to all PA traders!

DGTL - on its way to test resistance at 1.72

Image
DGTL = 1.6 (5.3%) DGTL was impressive today with its significant volume. Will it test the 1.72 resistance tomorrow? Resistance: 1.72 - recent new high Support: 130MA Good luck to all DGTL traders!

PSEi - New High

Image
PSEi = 3873.5 ( 2.6% ) PSEi was able to break the all time high of 3820.55. It is a concern that it made a new all time high without significant volume (394M). Support: 3820.55 - previous all time high Resistance PSEi trying to find resistance Good luck to all traders!

Apology

I would like to acknowledge and thank everyone who has patiently viewed this blog for updates. I would also like to apologize for failing to post up to date charts regarding the PSEi and listed companies on the Philippine stock exchange. I just got a new job at the University of the East Ramon Magsaysay Memorial Medical Center. Most likely our guru for technical analysis would comment that work really does interfere with trading :) hehehe :) I love my work :) It involves molding future doctors that would hopefully serve our countrymen. So that is my excuse, I just need some time to adjust to my schedule and hopefully I can continue to offer my humble technical analysis on the issues you are watching. Good luck to all traders :) Thank you for your patience and understanding :)