Posts

Showing posts from February 3, 2008

DJIA - higher low and higher high

Image
DJIA weekly formed a white candle with higher low and higher high. Volume continues to decrease for the 2nd week. DJIA confirms bullishness by formation of higher low and higher high. Good luck to all traders!

PSEi weekly - confirms hammer

Image
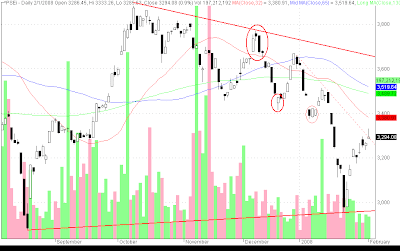
PSEi weekly formed a white candle with higher high and higher low. Previous candle which looked liked a bullish hammer seems to have been confirmed by formation of higher low and higher high. "...candlesticks with with long lower shadows and small real bodies. The real bodies are near the top of the daily range." - Steve Nison, description of a hammer and hanging man lines, on his book Japanese Candlestick Charting Technique Nison continued to state that: "If either of these lines emerges during a downtrend it is a signal that the downtrend should end. In such a scenario, this line is labeled a hammer, as in 'the market is hammering out' a base. Interestingly, the actual Japanese term for this line is takuri. This word means something to the effect of "trying to gauge the depth of the water by feeling for its bottom." I included this description from the authoritative book by Steve Nison on Japanese Candlesticks, as requested by an avid reader of th

DJIA - continues rally or uptrend

Image
DJIA = 12,743.19 ( 0.73% ) DJIA formed a white candle with higher high and higher low. Volume decreasing slightly. DJIA formed 5th straight white candle. DJIA rally or uptrend continues. Good luck to all traders!

PSEi - possible shooting star?

Image
PSEi = 3294.08 ( 0.90% ) PSEi formed a gap up white candle. Volume decreasing. PSEi looks a bit tentative with the possibility of a shooting star formation. "A shooting star is a two line pattern that sends a warning of an impending top." - Steve Nison, Japanese Candlestick Charting technique "... the shooting star has a small real body at the lower end of its range with a long upper shadow. As with all stars, the color of the real body is not important. the shooting star pictorially shows us that the market opened near its low, the strongly rallied and finally backed off to close near the open. In other words, that session's rally could not be sustained." - Steve Nison, JCCT I included this description from the authoritative book by Steve Nison on Japanese Candlesticks, as requested by an avid reader of the Technical Insider. I hope that this is not a shooting star. You can view from the charts that I placed a possible supply line that may serve as resistan