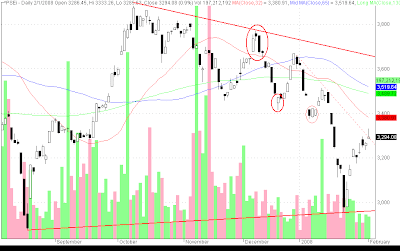
PSEi - possible shooting star?


PSEi = 3294.08 (0.90%)
PSEi formed a gap up white candle. Volume decreasing.
PSEi looks a bit tentative with the possibility of a shooting star formation.
"A shooting star is a two line pattern that sends a warning of an impending top."
- Steve Nison, Japanese Candlestick Charting technique
"... the shooting star has a small real body at the lower end of its range with a long upper shadow. As with all stars, the color of the real body is not important. the shooting star pictorially shows us that the market opened near its low, the strongly rallied and finally backed off to close near the open. In other words, that session's rally could not be sustained."
- Steve Nison, JCCT
I included this description from the authoritative book by Steve Nison on Japanese Candlesticks, as requested by an avid reader of the Technical Insider.
I hope that this is not a shooting star.
You can view from the charts that I placed a possible supply line that may serve as resistance for any further upward swing by the index.
Again, I hope this does not hold.
It was a good week for the index as it hit the parabolic SAR to signal a possible upward momentum and that the fast line was able to cross above the signal line of the MACD to signal a buy short both of which happened on 30 January 2008. These supported the possible return of the bulls.
PSEi looks poised to test the 32MA which serves as a resistance.
Careful traders...

Comments