Posts

Showing posts from November 11, 2007

DJIA weekly - downtrend

Image
DJIA weekly formed a white candle with a lower low and lower high. The weekly DJIA chart still shows that DJIA is still trending down and still might be looking for a stronger level of support. Support: 12,456 (Aug) Resistance:13,465; 13,716; 13,990 Good luck to all traders!

DJIA - white candle

Image
DJIA = 13,176.79 ( 0.51% ) DJIA formed a white candle with higher low and lower high and increasing volume. DJIA seems to be forming an aggressive demand line hoping to test the recent high at 13,465. Resistance: 13,465.2 Support: 12.910.4 Good luck to all traders!

FPH - long black candle

Image
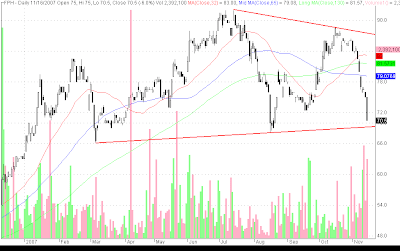
FPH = 70.5 ( -6.0% ) FPH formed a long black candle with lower low and lower high and significant volume. FPH has been trending down in a very steep slope and looks to test a 8+ months demand line. Will FPH bounce from this demand line? This will be answered come next trading week. FPH will definitely bounce the only question is when... the more prolonged and deeper the decline the more bounce FPH might have. Be careful in catching falling knives... Reversal signals to look out for would be a hammer or a bullish engulfing (which I definitely doubt given the length of the black candle). Most likely there will be follow thru selling for FPH come monday. I hope it only forms a small black candle so that the following candle can be white and engulf. Good luck to all FPH traders!

BPI - gap down long black candle

Image
BPI = 62 ( -6.8% ) BPI formed a gap down long black candle to retrace more than 50% of its previous uptrend. Bearish. BPI looking for support levels and may test possible demand line. Support: 61 Resistance: 65.5-66 Good luck to all BPI traders!

AT - testing support at 14

Image
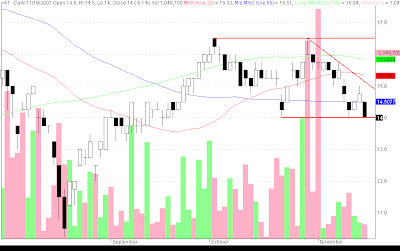
AT = 14 ( -5.1% ) AT formed a black candle with lower high and lower low to test a possible support level at 14. AT has formed an aggressive supply line. Bearish. Support: 14 Resistance: 65MA Good luck to all AT traders!