Posts

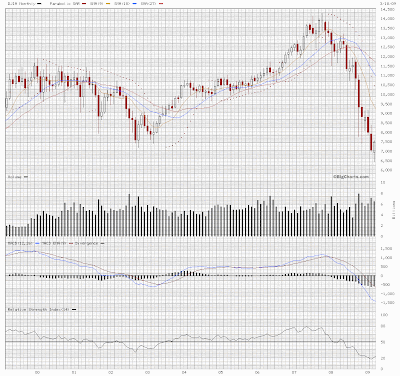
Is March 2009 forming a hammer?
Image
DJIA = 7486.58 First of all thank you for reading this post :) It has been quite a while since my last post :) Let me introduce you to the above chart generated for us by bigcharts.com :) This is a monthly candelstick chart of the DJIA for the past decade. We can note from this chart that the DJIA has again formed a new low for the past decade. I can only hope that the DJIA is truly forming a hammer for the march 2009. What Does Hammer Mean? A price pattern in candlestick charting that occurs when a security trades significantly lower than its opening, but rallies later in the day to close either above or close to its opening price. This pattern forms a hammer-shaped candlestick. Investopedia explains Hammer A hammer occurs after a security has been declining, possibly suggesting the market is attempting to determine a bottom. The signal does not mean bullish investors have taken full control of a security, it simply indicates that the bulls are strengthening. (from Investopedia.com) T...

The Big Fall (part 2: the effect)

Image

The Big Fall (part 1: the cause)

Image
Dow dives 777 points as House rejects bailout plan (from yahoo.com) NEW YORK - The failure of the bailout package in Congress literally dropped jaws on Wall Street and triggered a historic selloff — including a terrifying decline of nearly 500 points in mere minutes as the vote took place, the closest thing to panic the stock market has seen in years. The Dow Jones industrial average lost 777 points Monday, its biggest single-day fall ever, easily beating the 684 points it lost on the first day of trading after the Sept. 11, 2001, terrorist attacks. U.S. stocks hammered after House rejects rescue Dow posts biggest point loss ever, topping plunge after Sept. 11, 2001 By Kate Gibson, MarketWatch NEW YORK (MarketWatch) -- Stocks plunged Monday, with the Dow industrials plunging 777 points or their worst point drop on record, as the House of Representatives voted down the government's $700 billion financial bailout package. Congress calls Wall Street's bluff, and we lose Commentary...

[dot]NEWbie

Image
I recently received an email inviting me to include in my blog roll or blog list a site named [dot]NEWbie I decided to check out the site. It was delightful to view his commentary about the PSE and the lack of local investors. It was great that he placed in the numbers for us. I would really like to have the research that he was "quoting" but alas there is not link to the source. Please visit the site :) http://dotnewbie.com/ Its been quite a while now since I last posted... albeit look at any charts... Im planning to become more active again in the near future and TEL has sparked my interest. Hopefull I can materialize this planned before October ends :) Good luck to all the traders! Thank you for reading :)

AT - moving above possible resistance

Image
AT = 16.75 (+6.3%) AT formed a white candle with higher high and higher low. Volume of 9.4M greatest since 15 November 2007. AT was able to move above possible resistance of 16.5. Might test possible resistances at 16.75 and 17.25. Price of AT above the 32MA. AT still oversold based on the RSI at 77.8 MACD again poised to cross above the signal line, both above the zero line = Buy long AT pushing the upper Bollinger Band. AT hit the parabolic SAR which was serving as a level of resistance. Good luck to all AT traders!
Image
PSEi weekly PSEi formed another black candle with lower low and lower high. On its way to test the previous resistance line now likely to be acting as a support level. Good luck to all traders!

Day trading notes

Image
Day Trading notes DJIA up PSEi down Stocks to watch: SM - might test previous gap down, might form 3rd white candle, might move above 32MA MER - going down further SM formed higher high, amongst most active MEG amongst most active, new low since 10/13/2006