Posts

Showing posts from February 24, 2008

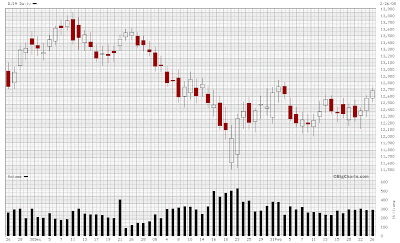
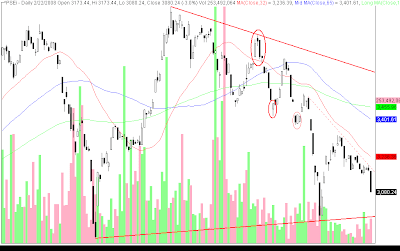
DJIA - big black candle; down 315.79 pts

Image
DJIA = 12,266.39 ( -2.51% ) DJIA forming an almost top shaven big black candle with lower low and lower high. Volume biggest since 1 February 2008. DJIA erased all the gains it made this week and then some more... Bearish... Looks like it will be a bloody trading day on Monday... Careful traders...

PSEi - testing aggressive resistance line

Image
PSEi = 3129.99 ( +0.60% ) PSEi formed a white candle with higher high and lower low. Volume continues to decrease. PSEi rallies to once again test the possible aggressive supply or resistance line. Good luck to all traders!

Day trading notes

Image
PSEi rallying? DJIA resting? Watching: MEG, PCOR, GMAP PX higher high, among most active, rallying to test possible resistance at 9.5 MEG testing support at 2.5 (change in price fluctuation 2.48 - 2.5 - 2.55), closed at its low of 2.48 below support of change in fluctuation of 2.5 PCOR testing possible support at 6.0 GMAP higher high TEL higher high, among most active SM higher high, among most active MER higher high, among most active PX higher high, among most active BDO higher high, among most active JFC higher high, among most active SMPH higher high, among most active OMW2 again trading at an all time low, among top losers NI among top gainers

Notes at the open

Image
Notes at the open PSEi rallying? DJIA resting? Watching: MEG, PCOR, GMAP PX higher high, among most active, rallying to test possible resistance at 9.5 MEG testing support at 2.5 (change in price fluctuation 2.48 - 2.5 - 2.55) PCOR testing possible support at 6.0

PCOR - breakout?

Image
PCOR = 6.2 ( +5.1% ) PCOR formed a white candle with higher high. Volume increased significantly. PCOR moved above possible resistance pegged at 6.0. I hope that this previous resistance line now becomes a level of support for PCOR. Good luck to all PCOR traders!

MEG - rally?

Image
MEG = 2.6 (12.1%) MEG formed a gap up white candle. Volume decreased. MEG moved above possible supply or resistance line. Bullish. MEG on its way to test 32MA. MEG RSI testing resistance line. Bullish. MEG about to hit parabolic SAR to signal possible rally or uptrend. Bullish. Good luck to all MEG traders!

GMAP - rally or uptrend?

Image
GMAP = 7.2 (+5.9%) GMAP formed another white candle with higher high and higher low. Volume continues to increase. GMAP moved above a possible supply or resistance line. Bullish. GMAP testing 65MA. Bullish GMAP pushing the upper limit of the Bollinger Bands. Bullish. Good luck to all GMAP traders!

DJIA - resting or top of rally?

Image
DJIA = 12,582.18 ( -0.88% ) DJIA forming a black candle with lower high and higher low. Volume decreasing slightly. After 4 straight days of forming white candles, DJIA finally forming a black candle. The question is whether this black candle is indicating the DJIA is merely resting before it continues to move higher or possibly top of the rally... Good luck to all traders!

PSEi - rally

Image
PSEi (0.3%) PSEi formed a doji with higher high and higher low. Volume decreased slightly. PSEi trying to rally and test supply or resistance line. Good luck to all traders!

Day trading notes

Image
PSEi virtually unchanged DJIA rallying and looking to test resistances MEG higher high, previously fell almost 8%

SM - on its way to test supply or resistance line

Image
SM = 290 (+2.7%) SM formed a white candle with higher high and higher low. Volume biggest since 14 February 2008. SM seems to have gained momentum and looks to test resistances: 1. 292.5 - recent high 2. 32MA 3. 300 - recent gap down 4. 310 - recent high Good luck to all SM traders!

DJIA - 3rd straight white candle with higher lows and higher highs

Image
DJIA = 12,684.92 DJIA forming another white candle with higher low and higher high. Volume increasing slightly. DJIA, unlike its local counterpart the PSEi, seems to be rallying and in the mood to test resistance levels... Bullish On its way to test 12,800? Good luck to all traders!

PSEi - almost unchanged

Image
PSEi = 3079.54 (0.0%) PSEi formed black candle with lower low and lower high. Volume increased slightly. PSEi almost top shaven with long bottom... Bearish? PSEi continues to respect aggressive supply or resistance line... It also seems to have accelerated the rate of decline of the supply or resistance line... Bearish PSEi RSI (34.5) about to hit the lower limit of 30 and signal oversold... Careful traders...

PSEi weekly - continues to form lower lows and lower highs

Image
PSEi weekly has formed a third straight black candle with lower low and lower high. PSEi weekly seems to be headed to test possible support line... Careful traders...

DJIA - consolidating

Image
DJIA = 12,381.02 () DJIA formed a white candle with lower low and lower high. Volume increased slightly. DJIA seems to be consolidating with a downward bias. I would really like to see the DJIA break resistances soon... Good luck to all traders...

PSEi - big black candle

Image
PSEi = 3080.24 ( -3.0% ) PSEi formed a big black candle with lower low and lower high. Volume increased. PSEi respecting aggressive supply or resistance line and possibly looking for a support level. Support may be pegged at: 2980... PSEi moved below the Parabolic SAR to signal reversal of previous trend... Bearish PSEi pushing the lower limits of the Bollinger Bands... Bearish PSEi might test lower limit of RSI at 30 and might test recent low of RSI at 21.65... Bearish... Careful traders...