Posts

Showing posts with the label edc

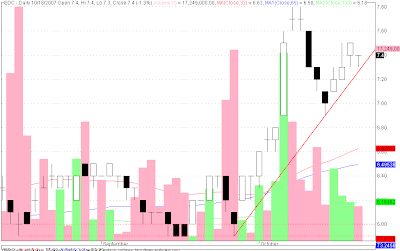
EDC - forming aggressive demand line

Image
EDC = 7.6 ( 1.3% ) EDC formed a white shaven candle with a higher high and higher low. I do hope EDC tries to test all time high of 7.8 Resistance: 7.6 Support: 7.4 Good luck to all EDC traders!

EDC - closed previous gap down

Image
EDC = 7.1 (0.0%) EDC was able to close the previous gap down - bullish sign. EDC formed a cross - mixed signal. EDC formed higher low and higher high - bullish signal. I am bullish with EDC. I am inclined to believe that EDC might be able to form a higher low tomorrow but I have my doubts as to whether EDC can also produce a higher high. A higher low will keep me from selling my position. A higher high, closing at its high with significant volume will most likely make me buy into EDC and hopefully that momentum will test the recent all time high of 7.8. Resistance: 7.4 Support: 7 Good luck to all EDC traders!

EDC - might have found support

Image
EDC = 7.1 ( -2.7% ) EDC might have found support from previous gap up. After opening gap down EDC tested support and then closed above its open to form a white candle. Though there is still a huge gap down to fill, EDC might be able to do that job. For the bulls to show us that they control EDC: EDC must form higher highs and higher lows on Tuesday. It is a concern that there is an aggressive supply line that will be a resistance level for EDC. Support: 6.9 Resistance: 7.1-7.3 Good luck to all EDC traders! Note: I would consider to buy EDC if it is able to form higher lows and higher highs tom with significant volume. It will certainly be a buy if it is able to gap up with big volume.

EDC - losing some momentum

Image
EDC = 7.4 ( 1.3% ) EDC might be seeing some resistance at 7.4 after failing to produce higher highs and might be seeing some support at 7.2. Note EDC steep demand line still intact but might be tested today... careful Note EDC trading above 32,65,130MA. Support: 7.2/7/6.9 Resistance: 7.4/7.7/7.8 Good luck to all EDC traders!

EDC - found trough and possible new support level to form steep demand line

Image
EDC 7.3 ( 1.4% ) EDC formed a trough at 6.9, which might be a new support level, to form a steep demand line Resistance: 7.8 Support: 7/6.9 Good luck to all EDC traders! PNOC-EDC potential bidders down to 16 10/11/2007 source: Technistock The number of potential bidders for the government's remaining 60-percent stake in PNOC Energy Development Corp. has gone down to 16 from the 24 that had submitted letters of interest. PNOC president Antonio Cailao said the 16 entities were those that met the Oct. 5 deadline for the submission of the initial pre-qualification requirements and passed the first screening process. The list of the pre-qualified bidders should have been released Wednesday, but Cailao said the PNOC Privatization Committee had decided to give the 16 entities a few more days to submit additional minor requirements. "Of the initial 24, eight have fallen off so we now have 16 potential bidders. But this number could still go down by the time the Privacom finishes its r...

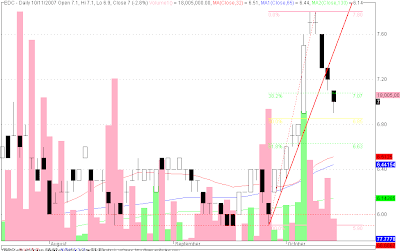
EDC - broke steep demand line to look for support

Image
EDC = 7 ( 2.8% ) EDC broke the steep demand line it formed to reach a new all time high to look for support. It may seen that it may have found it. It may seem it bounces from a support made by the recent gap up. Applying fibonacci retracement, EDC has retraced to almost 50% of its recent rally or uptrend, which may not be a healthy correction. 32, 65, 130 MAs are all trying to track the steep climb of EDC. Resistance: 7.8 Support: 6.9 (hopefully...) Good luck to all EDC traders! Note: if EDC forms a reversal pattern, hopefully a bullish engulfing it may be considered a buy...

EDC - new high

Image
EDC opened gap up with new high Disclosure bought edc at 7.1