NRCP During the first hour of trading, I noticed that NRCP's volume was picking up at this time it is forming another long white candle. Volume highest since July 23, 2010 Good luck to all traders! :)
NRCP = 2.65 (+1.90%) NRCP formed a white candle. Volume continues to decrease. NRCP seems to be testing support at 2.6. I hope the support holds. Fibonacci Retracement: more than 61.8%. Unhealthy retracement. NRCP will find it difficult to achieve the similar high formed by the previous rally or uptrend. 32MA acting as level of resistance. MACD: MACD crossed below signal line above the zero level to signal sell long. NRCP weekly: formed another black candle with lower low and lower high. Rally or Uptrend failed to move above a possible resistance at 2.95. Corrected more than 61.8% of the Fibonacci retracement level. Unhealthy retracement. Rally or uptrend less likely to occur following drastic correction. Seems to be forming aggressive supply or resistance line. Careful NRCP traders...
NRCP = 2.85 (0.0%) NRCP formed a white candle with lower low. Volume increasing. NRCP seems to be consolidating in the daily candlestick charts and respecting a possible aggressive supply or resistance line. NRCP weekly formed a doji with higher low and higher high. NRCP weekly on the other hand looks to be promising. NRCP weekly seems to be forming an aggressive support or demand line. I hope NRCP weekly continues to form higher highs. Good luck to all NRCP traders!
NRCP weekly formed a black candle with lower high and lower low. NRCP weekly seems to have formed a bullish hammer. This reversal pattern would be confirmed by NRCP if it manages to form higher lows in the succeeding weeks. Note: June 2007, NRCP weekly respected the bullish hammer formed and NRCP weekly was able to achieve a new all time high following the said reversal pattern. I hope NRCP weekly again respects the bullish hammer reversal :) Good luck to all NRCP traders!
NRCP = ( 3.8% ) NRCP formed another white candle with higher high and higher low. Volume decreasing. NRCP, after forming a new all time low at 2.55, has been forming higher lows and higher highs. Note: RSI of NRCP did not produce a new lower low despite price forming a new all time low. Divergence? Good luck to all NRCP traders!
NRCP = 2.85 ( -1.7% ) NRCP formed a white candle with lower low and lower high. Volume decreasing. NRCP seems to be forming a support level at 2.8. NRCP is forming an aggressive supply line or resistance line. NRCP trading below the 32MA = bearish RSI of NRCP forming an aggresive resistance line NRCP needs to hit the Parabolic SAR at 3.15 to signal a reversal of recent bearishness. Fast line below the slow line of the MACD and moving below the zero line. I do hope the support level at 2.8 holds. This can be confirmed if NRCP does not form a lower low on the following trading days. Good luck to all NRCP traders!
NRCP = 2.9 ( -3.3% ) NRCP formed another black candle with lower low and lower high. Volume decreasing. I hope NRCP is supported at the 2.85 level... Careful NRCP traders...
NRCP = 3.05 ( 1.70% ) NRCP formed higher low. Volume decreasing. NRCP seems to be forming an aggressive demand line. I do hope NRCP continues to form higher lows. Good luck to all NRCP traders!
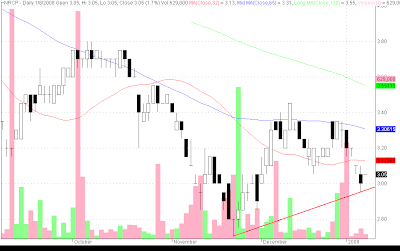
NRCP = 3.1 ( -3.10% ) NRCP formed a gap down doji. Volume increasing. Due to increase in unemployment in the US and increase in the risk of recession in the US, NRCP will likely feel the downward pressure come the start of the trading day or week. NRCP will likely break support at 3.05 and test or break support of recent low at 2.85 and all time low of 2.7. Take note of these support levels and take immediate action and cut losses accordingly. Careful NRCP traders... I hope we can mitigate the impact of the bloody trading days ahead...
NRCP = 2.95 ( 3.5% ) NRCP formed another white candle with higher high and higher low. Bullish Volume significantly lower than previous trading day. 32MA below 65MA; 65MA below 130MA - Bearish NRCP needs to trade above the 61.8% Fibonacci retracement. Support: 2.7 Resistance: 3.0-3.05 Good luck to all NRCP traders!
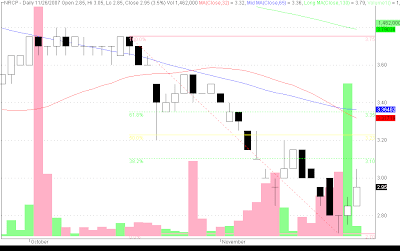
NRCP = 2.85 ( 1.8% ) NRCP formed a white candle with higher high and higher low and significant increase in volume since 3 October 2007. Bullish. NRCP might have found the bottom of its downtrend. NRCP must head back up more than 61.8% so that this recent rise in prices is not merely a correction of the downtrend. Said bottom might be considered a support level for NRCP. I hope NRCP continues to trend upwards. Using Fibonacci Retracements: one of the uses of fibonacci retracements is measuring the health of a pull back. Its seems vague. Let's use NRCP as an example: NRCP came from a recent high of 3.75/3.8 and trended downwards to hopefully produce a bottom at 2.75. If NRCP is to go down further it needs to pull back only until the 38.2% level for the pull back to be healthy and for NRCP to continue trending lower. If the pull back achieves more than 50% the pull back is not healthy. There can be a possible reversal that has formed or an area pattern could be forming. So f...
NRCP = 2.85 ( 1.8% ) NRCP formed a white candle with higher high and higher low and significant increase in volume since 3 October 2007. Bullish. NRCP might have found the bottom of its downtrend. NRCP must head back up more than 61.8% so that this recent rise in prices is not merely a correction of the downtrend. Said bottom might be considered a support level for NRCP. I hope NRCP continues to trend upwards. Good luck to all NRCP traders!
NRCP = 2.8 (0.0%) NRCP forms a doji and a new low at 2.7. Hopefully the doji can act as the support and it will be confirmed with formation of higher highs and higher lows Good luck to all NRCP traders...