Posts

Showing posts with the label gmap

GMAP - trying to close previous gap down

Image
GMAP = 7.5 (+1.4%) GMAP formed a white candle with higher high and lower low. Volume increased significantly. GMAP trying to close previous gap down. Good luck to all GMAP traders!

GMAP - rally?

Image
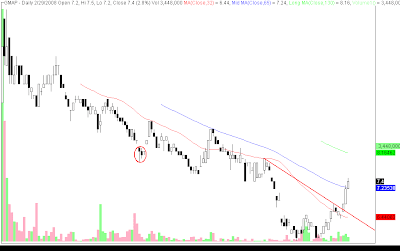
GMAP weekly formed another white candle with higher high and higher low. GMAP weekly parabolic SAR was also hit and is now hinting that GMAP might be trending upwards... GMAP = 7.4 ( +2.8% ) GMAP formed another white candle with higher low and higher high. Volume decreased. GMAP seems to have moved above a possible aggressive resistance or supply line. Bullish. GMAP seems to be rallying or trending up. Bullish. GMAP moved above the 65MA. Bullish. GMAP MACD now moving above the zero line, to signal a buy long. Bullish. GMAP RSI after breaking a possible resistance line continues to trend up and possibly test the overbought limit pegged at 70. Bullish. I hope GMAP continues this bullishness, but this coming bloody Monday will surely be a test of the strength of the upward momentum of GMAP... Good luck to all GMAP traders!

GMAP - rally or uptrend?

Image
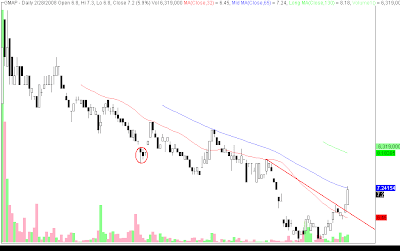
GMAP = 7.2 (+5.9%) GMAP formed another white candle with higher high and higher low. Volume continues to increase. GMAP moved above a possible supply or resistance line. Bullish. GMAP testing 65MA. Bullish GMAP pushing the upper limit of the Bollinger Bands. Bullish. Good luck to all GMAP traders!

GMAP - new all time low

Image
GMAP = 7.2 () GMAP formed a shaven top and bottom black candle with lower low and lower high. Volume increasing. GMAP achieved a new all time low... Careful GMAP traders...

GMAP - forming support at 7.4

Image
GMAP = 7.9 (0.0%) GMAP formed another white candle with higher low. Volume decreasing. GMAP seems to have formed a possible support at 7.4. I hope GMAP continues to form higher lows. Good luck to all GMAP traders!

GMAP - likely to test and break support at all time low of 7.4

Image
GMAP = 7.7 ( -2.5% ) GMAP formed a doji with higher low and lower high. Volume increasing. GMAP likely to test and break support formed by recent all time low at 7.4. Take note of support level and your stop loss levels and cut loss accordingly... Careful GMAP traders...

GMAP - forming a demand line

Image
GMAP = 8.6 ( 1.2% ) GMAP formed another shaven white candle with higher low and higher high. Bullish. GMAP after forming what seems to be an island reversal pattern has confirmed itself by reversing the downtrend to a more benign sideways or consolidation phase with an upward bias as can be noted by drawing a demand line from the recent lows. I can only hope that GMAP will once again test the possible resistance at 9 the recent high. Resistance: 9 Support: 8.5, 8.2 Good luck to all GMAP traders!

GMAP - gap up

Image
GMAP = 8.6 ( 2.4% ) GMAP formed a gap up white candle but volume was not big. GMAP might be on its way to test the aggressive supply line with the gap up as a level of support. Support: 8.4-8.5 (gap up) Resistance: 9 Good luck to all GMAP traders!

GMAP - possible island reversal

Image
GMAP = 8.5 ( 3.7% ) GMAP formed a gap up white candle but volume did not expand. GMAP looks to have formed an island reversal :) hopefully it reverses into an uptrend. It will be confirmed on Friday if there is an uptrend if GMAP is able to form higher highs and higher lows :) Resistance: 8.5 Support: 8.4 Good luck to all GMAP traders!

GMAP - gap down to reach new all time low

Image
GMAP = 8.2 ( 3.5% ) GMAP just keeps on forming lower and lower lows. A heartbreak to all who are bullishly holding on to this issue. GMAP also formed a gap down to really let us know that the bears are in charge. Support: 7.9 (likely to be tested again tomorrow) Resistance: 8.3 (likely to be a significant resistance level for days... weeks... months... to come...) Good luck to all GMAP traders... Note: If you wanted to get a seat at the board of GMA... GMA7 most likely will be a bargain in the coming days... so buy it then... then sell GMA to ABS for a profit... (hahaha! joke!)

GMAP - no where to go but down

Image
GMAP = 8.5 (0.0%) GMAP looks really bad... Monday will be bloody... How much more can GMAP bleed? Good luck to all GMAP traders...

GMAP - very aggressive supply line

Image
GMAP = 8.6 ( 2.3% ) GMAP broke support of 8.8 and seems to be forming very aggressive supply line. Careful GMAP traders...

GMAP - looking for support

Image
GMAP = 8.9 ( 1.1% ) GMAP continuing its slip and looking for support. Likely to test support at 8.8. Needs to form a reversal to signal a possible buy and hopefully enough momentum to test and break the resistance at 9.6 32MA acting as a resistance level. Good luck to all GMAP traders!