Posts

Showing posts with the label tel

TEL weekly - hammer

Image
TEL weekly formed a black candle with lower high and lower low. TEL weekly seems to have formed a bullish hammer. This hammer will be confirmed if TEL forms higher lows in the coming weeks. I hope it does :) Good luck to all TEL traders!

PHI - taking a cue from TEL ADR; TEL

Image
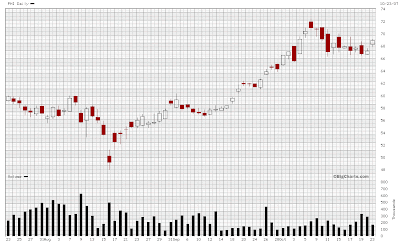
PHI = 65.38 ( -3.26% ) TEL = 2565 ( -7.40% ) PHI seems to have formed a doji with lower low and lower high. Volume increasing. TEL formed a gap down black candle. Volume decreasing. TEL formed a 7th black candle news: Fed cuts rate by 75 basis points Computation for possible gains if we bought TEL at the close of yesterday and TEL mirrors the close of PHI. 65.38 x 41.595 = 2719.48 PHI = 65.38 TEL = 2565 2719-2565=154 around 6% gain Good luck to all TEL traders!

TEL - forming support at 2970

Image
TEL = 2985 ( -2.0% ) TEL formed another black candle with lower high and lower low. TEL seems to be forming support at 2970/2975 level. Good luck to all TEL traders!

TEL - found support

Image
TEL = 3035 ( 0.7% ) TEL gap up to form white candle. Looks like TEL might have found a support level at 2970. TEL looks like it is on its way to test supply line. Good luck to all TEL traders!

TEL - looking for a level of support

Image
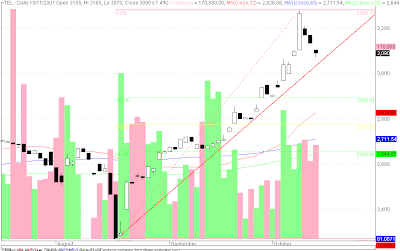
TEL = 3090 ( -1.4% ) TEL after reaching an all time high of 3285 seems to be looking for a level of support. Applying a fibonacci retracement to its recent rally or uptrend, we can note that a healthy correction at a 38.2% retracement should be around the 2890 level, at this level the price action may bounce and continue it ascent. Also note the very sharp demand line that I have drawn on the ascent of TEL, if this is broken TEL will most likely be in a corrective phase and thus look for a level of support Also note 2820 the recent previous high may act as a support. Resistance: 3825 - New all time high! Good luck to all TEL traders!