Posts

TA - likely to test and break support at 1.18

Image
TA = 1.3 (0.0%) TA formed doji with lower high. Volume increasing. Due to weakness of US markets TA will likely succumb to downward pressure and test and break support at 1.18. Take note of your stop loss levels and cut losses accordingly... Careful TA traders...

NRCP - will break support at 3.05

Image
NRCP = 3.1 ( -3.10% ) NRCP formed a gap down doji. Volume increasing. Due to increase in unemployment in the US and increase in the risk of recession in the US, NRCP will likely feel the downward pressure come the start of the trading day or week. NRCP will likely break support at 3.05 and test or break support of recent low at 2.85 and all time low of 2.7. Take note of these support levels and take immediate action and cut losses accordingly. Careful NRCP traders... I hope we can mitigate the impact of the bloody trading days ahead...

DJIA weekly - 2nd black candle

Image
DJIA = 12,800.18 DJIA formed a second black candle with lower low and lower high. Volume increasing. DJIA seems to be headed south to test support at 12,700 or 12,500 (recent lows). These weakness has been fueled by increase in the unemployment rate in the US which might herald a recession. The local market will certainly suffer the same downward pressure come the start of trading this week. Careful traders...

DJIA - 6th black candle, rise in unemployment, headed for recession

Image
DJIA = 12,800.18 ( -1.96% ) DJIA formed another black candle with lower low and lower high. Volume increasing. DJIA might test support at recent low of 12,700. DJIA suffered last Friday due to increase in unemployment in the US which might herald the coming of a recession. Due to the weakness last Friday in the US stock market it is more certain than not that we will suffer the same sell off in the local market once trading starts on Monday. Take note of your stop loss levels and be disciplined in observing them. Better to lose small than to lose big. Careful traders...

PSEi - likely to break demand line

Image
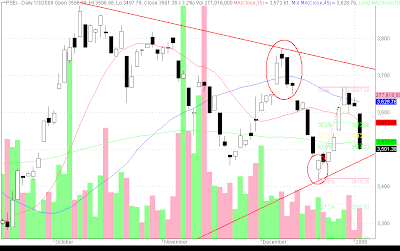
PSEi = 3479.37 ( -0.60% ) PSEi formed a gap down black candle. Volume decreased. Given the dismal performance of the US market last friday, PSEi likely to break demand line. Look for support at recent low of 3414 or 3258 (yikes!). It it more certain than not that PSEi will have a very bloody market come Monday's trading... US makets heralds recession with increase in unemployment rate... Careful traders...

PSEi - gap down, long black candle

Image
PSEi = 3504.38 ( -3.2% ) PSEi formed a gap down looong black candle. Volume increasing. Bearish. PSEi now trading below 32MA, 65MA, and 130MA. Bearish. PSEi has retraced more than 61.8% of the recent rally. Unhealthy retracement of the recent rally. Less likely for the rally/uptrend to continue. RSI heading south. MACD: Fast line about to cross below slow line... Both lines below zero line... Careful traders... Looks like an awful start for the year of trading the stock market...

DJIA - selloff?

Image
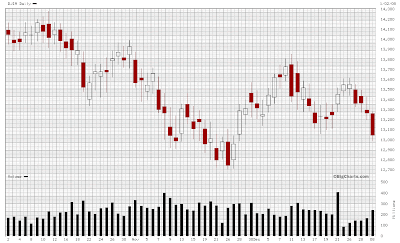
DJIA = 13,043.96 ( -1.67% ) DJIA formed another black candle, for the 4th time, with lower low and lower high. Increasing volume. DJIA moved below support at 13,100 (a recent previous low). Bearish? might test support at 12,800... Careful traders...